How to view data sent to Google Analytics
So in my previous post the basics of web analytics I showed you how the Google Analytics javascript is used to retrieve information about the visitor and the content they are interacting with on your website, then in the follow up post called Google Analytics Cookies and their values I discussed how cookies were used to store persistent data and calculate things like the current visit (also known as a session) and manage campaign data.
In this post I’ll discuss how to use Chrome Developer Tools to inspect information as it gets sent to Google Analytics. Knowing how to use this tool will make future troubleshooting much easier, but it will also give you a better understanding of how Google Analytics reports are generated.
Note: In these examples I’m going to use Chrome Web Browser to view http requests between my browser and Google Analytics servers. You can also use these other tools if you prefer?
Step 1.
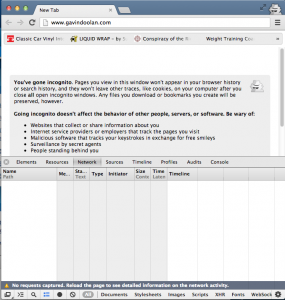
Open a new tab in your Browser.
In the address bar type in the URL you wish to check (but don’t hit return yet!).
My site is www.gavindoolan.com so that’s the page I’ll use in this example.
Step 2.
Open the developer tools console. It should be sitting at the bottom of your page.
You should see something similar to the above screenshot. Also make sure you click on the Network tab as shown above.
Step 3.
Now load the page in your address bar (you can hit return now!). You should see a steady stream of requests showing up in Chrome Developer Tools. Depending on your website, you may see lots of requests here.
Note: On this page there is currently 25 requests and the page loaded within 2.16s.
Step 4.
So now the important part, we need to find the Google Analytics request. For classic Google Analytics properties (i.e non Universal Analytics) this request begins with __utm.gif (remember it’s a 1×1 pixel image?).
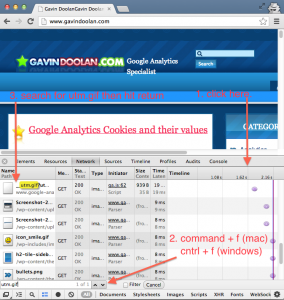
To find this request quickly you can search the requests for ‘utm.gif’ search string, but Chrome Developer tools is actually a little tricky to use the search function on so here is a little trick.
You need to make sure Chrome Developer Tools window (or overlay) is active . To do this simply click on the bar running along the top of the window (#1). Then use command key + f (for Mac) or cntrl + f (Windows / Chromebook) to bring up the search dialog (#2). Next search for the string ‘utm.gif’ (#3), press enter / return and it should highlight the Google Analytics request(s) for you.
Step 5.
Once you have found the __utm.gif request in the list. Click on the request to bring up more information about this item. By default you may see the Preview tab, however it’s the Headers tab we are interested in.
The request URL is the full request sent to Google Analytics. In this form it’s actually quite difficult to read at a glance, so Chrome Developer Tools actually breaks it out for us into a more readable format. If you look under the section Query String Parameters you’ll see a key / value pair for example the first value is utmwv: 5.4.2.
Each of these key / value pairs represents a piece of information that is being sent to Google Analytics.
How can you figure out what’s what? Well you can refer to the gif request parameters which is a table that explains what each of these parameters are.
Note: Although the table on the Google Analytics code site is useful several parameters are not completely documented. If you see an undocumented 1 and want to know about it, just ask me in the comments section.
For example you’ll see that utmwv represents the tracking code version (of ga.js -classic Google Analytics). You may use this information in conjunction with the changelog here for example to determine what version is in use on your website.
I won’t cover all of these parameters here, instead I’ll just pull out a few key ones that I most frequently use when inspecting client websites.
- utmhn – hostname
- utme – event and custom variable information
- utmac – Google Analytics account number
- utmr – the referrer
- utmp – the page or URL
- utmcc – The Google Analytics cookie values (_utma and _utmz)
Knowing and understanding what these values represent can be extremely helpful when debugging tracking code inconsistencies, but it can also be useful when setting up custom tracking for things like events, social interactions, custom variables, e-commerce tracking and so forth.
Hopefully now you can see how elements such as javascript, cookies and images come together to produce the reports you know and love in Google Analytics?


Leave a Reply